Utilizing Infographics for SEO: Our Expert Approach
In the ever-evolving landscape of digital marketing, standing out in search engine results has become increasingly competitive. One effective strategy for grabbing attention and boosting your SEO performance is through the use of infographics. As humans are largely visual creatures, we retain 65% of the information we see, compared to only 10% of what we hear.
By incorporating visual content like infographics into your content marketing strategy, you can generate 650% more engagement than static content that contains only text. At White Sand, we help businesses leverage infographics to improve their SEO metrics and drive real results. For more information, contact us at deepali@whitesand.co.in or visit our website at https://whitesand.co.in/.
Key Takeaways
- Infographics are a powerful tool in modern SEO strategy.
- Visual content generates 650% more engagement than text-only content.
- Humans retain 65% of visual information, making infographics invaluable.
- Our expert approach helps businesses leverage infographics for better search visibility.
- A well-crafted content marketing strategy can drive real SEO results.
The Power of Visual Content in Digital Marketing
The power of visual content in digital marketing lies in its capacity to engage users more effectively than text-only content. In today’s digital landscape, visual content has become a crucial element for marketers aiming to capture audience attention and drive engagement.
Why Visual Content Outperforms Text-Only Content
Research has shown that content like videos and infographics generates 650% more engagement than static content containing only text. This is because our brains process visual information more efficiently. MIT neuroscientists have found that we can process images in just 13 milliseconds, making visual content a powerful tool for communication.
Visual content not only captures attention but also enhances user experience by making complex information more digestible. This is particularly important in digital marketing, where engagement and attention are key metrics for success.
| Content Type | Engagement Metric | Backlink Generation |
|---|---|---|
| Text-Only Content | Baseline | Baseline |
| Visual Content (Infographics) | 650% increase | 178% more backlinks |
How Infographics Fit into Modern SEO Strategy
Infographics are a versatile content type that appeals to both users and search engines. Blogs containing infographics produce 178% more backlinks than those without, making them powerful link-building assets. By incorporating infographics into an SEO strategy, marketers can improve user engagement, increase dwell time, and reduce bounce rates.
Infographics help break up text-heavy content, making pages more scannable and user-friendly. They can be strategically placed to emphasize key points and improve overall content comprehension. As a result, visual content like infographics is ideal for explaining technical or data-heavy topics.
What Are Infographics and Why They Matter for SEO
The use of infographics in SEO has revolutionized the way we present complex information. Infographics are visual representations of information, data, or knowledge designed to present complex data quickly and clearly. They often combine images, charts, diagrams, and minimal text to convey a topic in a visually engaging manner.
Defining Infographics in the Context of SEO
In the context of SEO, infographics serve as a powerful tool to enhance content visibility and engagement. By incorporating visual elements, infographics make complex information more digestible and memorable, which can lead to improved user experience and higher engagement rates.
Key Characteristics of Engaging Infographics
Effective infographics possess certain key characteristics, including clarity, engagement, accuracy, simplicity, and visual appeal. They combine charts, graphs, images, and minimal text to create easily digestible content that resonates with audiences. Common elements found in successful infographics include images, icons, text, charts, graphs, diagrams, maps, and graphics.
The Role of Infographics in Content Marketing
Infographics play a crucial role in content marketing by simplifying complex topics and making information more memorable. They help content stand out in crowded search results, potentially improving click-through rates from search engine results pages. Moreover, infographics can be used to target featured snippets and other SERP features, increasing visibility in search results. By complementing text-based content with infographics, we can create a more diverse content strategy that enhances overall user engagement.
The SEO Benefits of Utilizing Infographics
Infographics are not just visually appealing; they also provide substantial SEO benefits that can elevate your online presence. By incorporating high-quality infographics into your content strategy, you can significantly enhance your website’s visibility and search engine rankings.
Enhanced User Engagement and Dwell Time
One of the primary SEO benefits of infographics is their ability to increase user engagement and dwell time. When visitors are presented with engaging visual content, they are more likely to spend longer periods on your site, exploring the information provided. This increased dwell time signals to search engines that your content is valuable and relevant, thereby improving your SEO performance.
Attracting High-Quality Backlinks
Infographics are highly effective at generating high-quality backlinks. Research has shown that blogs containing infographics produce 178% more backlinks than those without. When other websites use your infographic, they typically include a link back to your site as the source, thereby improving your site’s domain authority and page rank.
| SEO Benefit | Description | Impact |
|---|---|---|
| Backlinks | Infographics generate high-quality backlinks | Improves domain authority and page rank |
| User Engagement | Increased dwell time and interaction | Signals value to search engines |
| Social Shares | Infographics are highly shareable | Boosts brand visibility and referral traffic |
Boosting Social Shares and Brand Visibility
Infographics are highly shareable on social media platforms, generating referral traffic and providing social signals that boost search rankings. As your infographic is shared across various platforms, your brand visibility and awareness expand, creating additional opportunities for organic link building.
Improving Keyword Optimization Opportunities
Infographics provide unique keyword optimization opportunities through file names, alt text, and surrounding content. By optimizing these elements with relevant keywords, you can further enhance your SEO efforts and improve your content’s visibility in search engine results.
In conclusion, incorporating infographics into your SEO strategy can yield significant benefits, from enhanced user engagement and high-quality backlinks to improved social shares and keyword optimization opportunities. By leveraging these visual elements effectively, you can elevate your online presence and drive more traffic to your site.
6 Types of Infographics That Drive SEO Results
In the realm of digital marketing, infographics have emerged as a key strategy for enhancing user engagement and SEO. By presenting complex information in a visually appealing format, businesses can capture audience attention and drive meaningful interactions. Let’s explore the six types of infographics that consistently deliver strong SEO results across various industries and topics.
Statistical Infographics
Statistical infographics visualize data sets using charts, graphs, and numbers, providing clear insights that are highly sought after by bloggers and digital marketers. These infographics are particularly effective at generating backlinks, as they offer valuable statistics that can be used to support content.
Informational Infographics
Informational infographics serve as educational resources by defining key terms, outlining complex concepts, and explaining industries. They attract organic traffic by providing valuable information that audiences are searching for online.
Timeline Infographics
Timeline infographics map out historical events, trends, or milestones in a visually engaging format. By creating a narrative that unfolds over time, these infographics increase user engagement and dwell time on websites.
Comparison Infographics
Comparison infographics are particularly effective for commercial intent keywords, as they contrast products, services, or concepts. This type of infographic aids decision-making processes, making them valuable for businesses.
| Type of Infographic | Purpose | SEO Benefit |
|---|---|---|
| Statistical | Visualize data | Generate backlinks |
| Informational | Educate audience | Attract organic traffic |
| Timeline | Map events | Increase dwell time |
| Comparison | Contrast products/services | Aid decision-making |
| How-to | Provide step-by-step guides | Capture featured snippets |
| Map | Highlight geographical data | Appeal to visual learners |
How-To Infographics
How-to infographics teach audiences how to accomplish tasks through step-by-step instructions. By satisfying instructional search queries, these infographics can capture featured snippets and enhance a website’s visibility.
Map Infographics
Map infographics use visual maps to highlight geographical information or visualize concepts in a spatial format. They appeal to visual learners and can be particularly effective for businesses with a geographical focus.
By understanding and leveraging these six types of infographics, businesses can create a robust content strategy that drives SEO results, enhances user engagement, and supports various content goals.
Creating SEO-Friendly Infographics: Our Step-by-Step Process
Our step-by-step process for creating SEO-friendly infographics ensures they are both informative and optimized. This process is designed to help you achieve your goals, whether that’s generating backlinks, establishing thought leadership, or increasing social shares.
Defining Your Goals and Target Audience
Begin by defining your goal. What do you ultimately want to achieve from creating an infographic? Your goal will inform the style of infographic you create. For instance, if you want to generate lots of backlinks, you might create statistical infographics. It’s also crucial to choose a topic that your target audience is passionate about. Research your audience by building a buyer persona that encompasses their pain points, desires, habits, and demographics.
- Identify your primary objective for creating the infographic.
- Develop a buyer persona to understand your target audience.
Conducting Keyword Research for Infographics
Conducting keyword research specifically for infographics is vital. You need to find keywords with high search volume and low competition that can be effectively visualized. This involves using tools to analyze search trends and identifying relevant keywords that align with your infographic’s topic.
Collecting and Organizing Your Data
Collecting reliable, accurate data from authoritative sources is essential. This data will form the backbone of your infographic. Ensure that your data is up-to-date and relevant to your topic. Organize your data in a way that tells a cohesive story and guides the viewer’s eye naturally.
Planning Your Infographic Structure
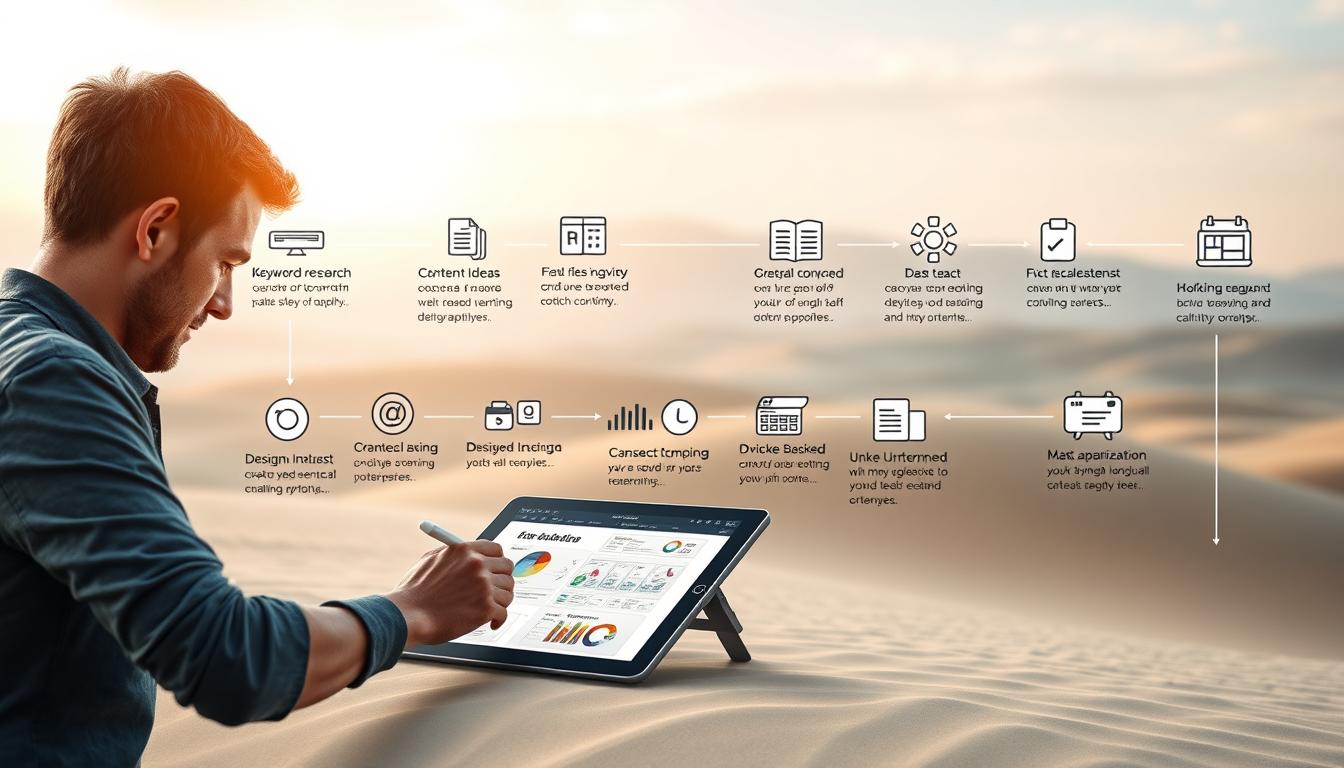
Plan your infographic’s structure to emphasize the most important information and create a clear information flow. This involves deciding on the visual hierarchy and ensuring that the infographic is easy to follow. By doing so, you’ll create an infographic that is not only visually appealing but also optimized for search engines.
By following our step-by-step process, you can create SEO-friendly infographics that drive results. Whether your goal is to increase brand visibility or generate backlinks, our approach will help you achieve success.
Infographic Design Best Practices for Maximum Impact
As we dive into the world of infographic design, it’s essential to understand the principles that make them visually appealing and SEO-friendly. Creating effective infographics is both an art and a science, requiring a deep understanding of visual elements, color theory, and typography.
Visual Hierarchy and Information Flow
A well-designed infographic guides the viewer’s eye through the information in a logical sequence. Visual hierarchy is crucial here, ensuring that the most important points stand out. This can be achieved by using size, color, and placement to draw attention to key data.
Color Theory and Typography Considerations
The choice of color scheme and typography can significantly impact the readability and aesthetic appeal of an infographic. Colors should align with the brand identity and complement the topic, while fonts should be readable across different devices.

Balancing Text and Visual Elements
Striking the right balance between text and visual elements is vital. Too much text can be overwhelming, while too many visuals can make the infographic confusing. Icons, charts, and graphs can help break up the text and enhance comprehension.
Creating Mobile-Friendly Infographics
With the rise of mobile search, it’s crucial that infographics are mobile-friendly. This means designing them to be easily viewed on smaller screens, with clear typography and appropriately sized visual elements.
| Design Element | Best Practice |
|---|---|
| Visual Hierarchy | Use size and color to highlight key points |
| Color Scheme | Align with brand identity and topic |
| Typography | Choose readable fonts |
| Text and Visuals | Balance text with icons, charts, and graphs |
| Mobile-Friendliness | Ensure clear typography and sized visuals |
Utilizing Infographics for SEO: Technical Optimization Tips
Technical optimization of infographics is essential for improving their visibility in search results. When creating infographics, it’s crucial to ensure they are optimized for relevant keywords to maximize their SEO potential.
Optimizing File Names and Alt Text
One of the simplest yet most effective ways to optimize your infographics is by using descriptive file names and alt text. Instead of naming your file “infographic1.png,” use a descriptive name like “best-practices-for-seo-infographics.png.” This helps search engines understand the content of your infographic. Similarly, use alt text that accurately describes your infographic and incorporates your target keywords.
Using Header Tags Effectively
The content surrounding your infographic is just as important as the infographic itself. Using header tags (H1, H2, H3, etc.) effectively creates a logical structure that search engines can easily crawl. This not only improves the readability of your content but also enhances its SEO.
Crafting SEO-Friendly URLs and Meta Descriptions
If you’re creating a page or blog post to host your infographic, ensure that the URL and meta description are optimized for SEO. Use relevant keywords in your URL and meta description to improve visibility in search results. For example, a URL like “example.com/seo-infographic-tips” is more descriptive than “example.com/infographic123.”
Optimizing Loading Speed for Infographics
Infographics can be large files, which can impact your page’s loading speed. Optimizing your infographic’s file size without sacrificing quality is crucial. Use image compression tools and consider the file format to ensure your infographic loads quickly. A faster loading speed not only improves user experience but also contributes to better SEO rankings.
By implementing these technical optimization tips, you can significantly improve the SEO value of your infographics. Remember, optimization is an ongoing process that requires monitoring and adjustments to achieve the best results.
Promoting Your Infographics for Maximum SEO Value
The creation of an infographic is just the first step; promoting it effectively is what truly matters for SEO. To maximize the SEO value of your infographics, you need to implement a comprehensive promotion strategy that goes beyond just publishing them on your website.
Social Media Promotion Strategies
Social media platforms are crucial for promoting your infographics. Share your infographic across various platforms like X (Twitter), LinkedIn, and Pinterest. Infographics perform exceptionally well on visually-driven platforms such as Pinterest and Instagram. By leveraging these platforms, you can significantly increase your infographic’s visibility and drive traffic to your site.
Email Outreach and Link Building
Email outreach is another effective way to promote your infographics. Reach out to bloggers, industry influencers, or websites within your niche and offer them your infographic. Explain how your infographic complements their content and why their audience would benefit from it. This strategy can help you secure valuable backlinks and expand your reach.
Submitting to Infographic Directories
There are numerous infographic directories where you can submit your infographics for added visibility and backlinks. Submitting to these directories can provide additional exposure and quality backlinks with minimal effort. Some popular directories include Visual.ly, Infographic Journal, and Cool Infographics.
Repurposing Infographics Across Platforms
To extend the lifespan of your infographic and reach new audiences, consider repurposing it across different platforms and formats. For example, you can turn your infographic into a video or a slide presentation. This approach allows you to maximize the value of your content and cater to different learning preferences.
To further enhance your promotion efforts, create embed codes that make it easy for others to share your infographic while automatically including a backlink to your site. Track the performance of your infographic promotion efforts to identify which channels drive the most traffic and links. By understanding what works best, you can refine your strategy and maximize your SEO results.
- Share infographics on social media platforms to increase visibility.
- Conduct email outreach to secure backlinks from relevant websites.
- Submit infographics to directories for additional exposure.
- Repurpose infographics into different formats to reach new audiences.
- Use embed codes to facilitate sharing and backlinking.
- Monitor performance to refine your promotion strategy.
Tools and Resources for Creating Professional Infographics

The key to designing effective infographics lies in utilizing the most suitable tools and resources. With numerous options available, it’s essential to choose the right ones that fit your needs and budget.
Free vs. Paid Infographic Creation Tools
When it comes to creating infographics, you can choose between free and paid tools. Free tools like Canva, Venngage, and Piktochart offer a range of templates and design features that are perfect for beginners or those on a tight budget. On the other hand, paid options like Adobe Illustrator and Infogram provide advanced features and customization options for more complex designs.
Data Visualization Resources
To transform complex statistics into compelling visual stories, you can leverage specialized data visualization resources. These tools help you create interactive and dynamic visualizations that enhance your infographics.
Stock Image and Icon Libraries
To add high-quality visual elements to your infographics, you can use stock image and icon libraries. These libraries provide a vast collection of images and icons that can be used to enhance your designs.
At White Sand, we can help create custom, professional infographics tailored to your specific SEO goals. For more information, contact us at deepali@whitesand.co.in or call (+91)98259-40020. Visit our website at https://whitesand.co.in/ for more details.
The Guestographic Method: Advanced Link Building with Infographics
To further amplify your SEO strategy, we introduce guestographics, a sophisticated method that combines the strengths of infographics and guest posting. Guestographics are visually engaging content pieces designed for sharing on external websites, leveraging the visual appeal of infographics while incorporating the advantages of guest posting to enhance exposure, authority, and link-building.
What Are Guestographics and How They Work
Guestographics represent a form of off-page SEO that capitalizes on the popularity of visual content. By creating high-quality, relevant infographics for other websites, you can secure high-quality backlinks that boost your website’s authority and ranking. This approach not only enhances your SEO efforts but also increases your brand’s visibility across the web.
Implementing a Successful Guestographic Strategy
To implement a successful guestographic strategy, start by identifying relevant and authoritative websites in your niche. Craft compelling outreach emails that highlight the value of your guestographic, and be prepared to negotiate placement. Focus on creating content that is not only visually appealing but also provides valuable insights or information to the host site’s audience.
Measuring the Success of Your Guestographic Campaigns
The success of your guestographic campaigns can be measured through key metrics such as referral traffic, backlink quality, and improvements in search ranking. By monitoring these metrics, you can refine your strategy to maximize the SEO benefits of your guestographics. Effective measurement is crucial for understanding the impact of guestographics on your overall SEO performance.
As you integrate guestographics into your broader off-page SEO strategy, you’ll be able to build trust and authority with both users and search engines, ultimately enhancing your website’s online presence.
Case Studies: Successful Infographic SEO Campaigns
By analyzing successful infographic SEO campaigns, we can identify key factors that contribute to their success. In this section, we’ll examine real-world examples of how infographics have driven significant results for businesses.
WordStream’s Viral Infographic Success
WordStream, an Internet marketing software provider, achieved notable success with its viral infographic campaigns on “Internet Privacy” and “Google Flops.” The success was driven by careful planning, strategic topic selection, and aggressive promotion. By choosing engaging topics, conducting thorough research, connecting with influencers, and employing targeted outreach on social media, WordStream surpassed its goals. The infographics gained visibility on significant platforms like Reddit, Digg, and StumbleUpon, resulting in nearly 3,500 links, including placements on influential sites like CNN.com and TechCrunch.
Copyblogger’s Long-Term Infographic Strategy
Copyblogger, a renowned content marketing platform, unveiled an infographic titled “15 Grammar Goofs” in 2012. The seemingly simple graphic turned out to be a powerhouse in terms of engaging content and generating substantial social media traction. Even years after its initial release, the infographic continues to drive traffic and engagement, demonstrating the long-term value of well-crafted infographics.
Key Takeaways from Successful Campaigns
Analyzing these case studies reveals several key takeaways that can be applied to your own infographic strategy. These include the importance of strategic topic selection, thorough research, and targeted promotion. The following table summarizes the key elements that contributed to the success of these campaigns:
| Campaign Element | WordStream | Copyblogger |
|---|---|---|
| Topic Selection | Internet Privacy, Google Flops | 15 Grammar Goofs |
| Research Process | Thorough research on selected topics | Compilation of grammar mistakes |
| Promotion Strategy | Aggressive social media outreach, influencer connections | Social media promotion, content marketing |
| Results | Nearly 3,500 backlinks, hundreds of leads | Long-term traffic and engagement |
By understanding and adapting these successful strategies, businesses can enhance their own infographic SEO campaigns and achieve significant results.
Common Mistakes to Avoid When Creating Infographics for SEO
To maximize the SEO benefits of infographics, it’s crucial to avoid common mistakes. Infographics can significantly enhance your content strategy, but their effectiveness can be undermined by several pitfalls.
Overloading with Information
One of the most significant mistakes is overloading infographics with excessive information. This can dilute key messages and overwhelm viewers, reducing engagement and shareability. It’s essential to strike a balance between providing valuable information and keeping the design clean and concise.
Poor Mobile Optimization
With an increasing number of users browsing the web on mobile devices, ensuring that your infographics are mobile-friendly is critical. Consider creating long-scroll infographics that adjust well to different screen sizes, or use HTML5-based interactive infographics that adapt dynamically.
Neglecting Technical SEO Elements
Technical SEO elements are frequently neglected when creating infographics. Proper file naming, alt text implementation, and structured data markup are crucial for search engine visibility. Ensuring that these elements are in place can significantly improve the SEO impact of your infographics.
Insufficient Promotion
Insufficient promotion is often the biggest reason infographics fail to generate SEO results, regardless of their quality. Developing a comprehensive promotion strategy, including social media promotion, email outreach, and link building, is essential to maximize the SEO value of your infographics.
By avoiding these common mistakes, you can create infographics that not only enhance user experience but also contribute significantly to your SEO efforts. Ensuring that your infographics are well-designed, technically optimized, and effectively promoted will help you achieve your SEO goals.
Measuring the SEO Impact of Your Infographics
Measuring the SEO impact of infographics is essential for quantifying their effectiveness and demonstrating ROI. To understand the full value of your infographics, you need to track their performance across various metrics.
Key Metrics to Track
To evaluate the SEO impact of your infographics, focus on metrics such as referral traffic, backlinks, social shares, and engagement metrics. Referral traffic helps you understand how many visitors are coming to your site from the pages where your infographic is embedded. Backlinks are crucial for SEO as they signal to search engines that your content is valuable and worthy of citation.
Social shares and engagement metrics, such as likes, comments, and time spent on page, provide insights into how your audience interacts with your infographic. Tools like Google Analytics can help track referral traffic, while specialized tools like Hike SEO can monitor backlinks.
Tools for Monitoring Infographic Performance
Various tools are available to monitor the performance of your infographics. Google Analytics is invaluable for tracking traffic generated by your infographics. For backlink monitoring, tools like Ahrefs or SEMrush can be used. Social media platforms also offer built-in analytics to measure shares and engagement.
Adjusting Your Strategy Based on Data
Once you’ve collected data on your infographic’s performance, use it to adjust your strategy. Analyze the data to identify patterns and draw insights. For instance, if you notice that certain types of infographics generate more engagement, you can focus on creating similar content in the future.
By continuously monitoring your infographics’ performance and adjusting your strategy accordingly, you can maximize their SEO impact and improve your overall content marketing results.
Conclusion: Integrating Infographics into Your Overall SEO Strategy
By integrating infographics into our SEO strategy, we can create a more engaging and diverse content ecosystem. This approach not only enhances user experience but also improves our visibility on search engines. Throughout this article, we’ve explored the various ways infographics can boost our SEO efforts, from increasing user engagement and dwell time to attracting high-quality backlinks and improving keyword optimization opportunities.
To effectively integrate infographics into your overall SEO strategy, it’s essential to develop an editorial calendar that incorporates visual content at strategic intervals. This ensures consistency without overwhelming your resources. Additionally, aligning your infographic creation with your broader keyword strategy is crucial to ensure that all visual content supports your SEO goals. By leveraging the unique strengths of infographics at different stages of the buyer’s journey, you can create a more comprehensive content strategy that appeals to various user preferences.
Moreover, repurposing successful infographics into other content formats can maximize their value and reach. As your SEO strategy matures, scaling your infographic production can help maintain momentum. It’s also important to continuously evolve your infographic approach based on changing search engine algorithms, user preferences, and industry trends. For professional assistance with integrating infographics into your SEO strategy, you can contact White Sand at deepali@whitesand.co.in or call (+91)98259-40020. Visit their website at https://whitesand.co.in/ for more information about their services.
FAQ
What is the primary purpose of using infographics in digital marketing?
We use infographics to present complex information in a visually appealing way, enhancing user engagement and dwell time on our website.
How do infographics improve our SEO strategy?
Infographics attract high-quality backlinks, boost social shares, and increase brand visibility, all of which contribute to improved keyword optimization opportunities and better search engine rankings.
What types of infographics are most effective for SEO?
We find that statistical, informational, timeline, comparison, how-to, and map infographics drive SEO results by providing valuable content that resonates with our target audience.
How do we optimize infographics for search engines?
We optimize file names and alt text, use header tags effectively, craft SEO-friendly URLs and meta descriptions, and ensure fast loading speeds to improve infographic visibility in search results.
What are some common mistakes to avoid when creating infographics for SEO?
We avoid overloading with information, poor mobile optimization, neglecting technical SEO elements, and insufficient promotion to ensure our infographics achieve maximum impact.
How do we measure the SEO impact of our infographics?
We track key metrics such as engagement, backlinks, and social shares, and use tools to monitor infographic performance, adjusting our strategy based on data to optimize results.
What tools do we use to create professional infographics?
We utilize a range of tools, including free and paid infographic creation tools, data visualization resources, and stock image and icon libraries, to create high-quality infographics that engage our audience.
